
Telusur Mahija
Unifying Fragmented Beneficiary Data into One Production Platform
Designing and implementing an internal platform for Mahija's program, operational, and management workflows.
Launched in August 2026, one month ahead of the original September deadline.
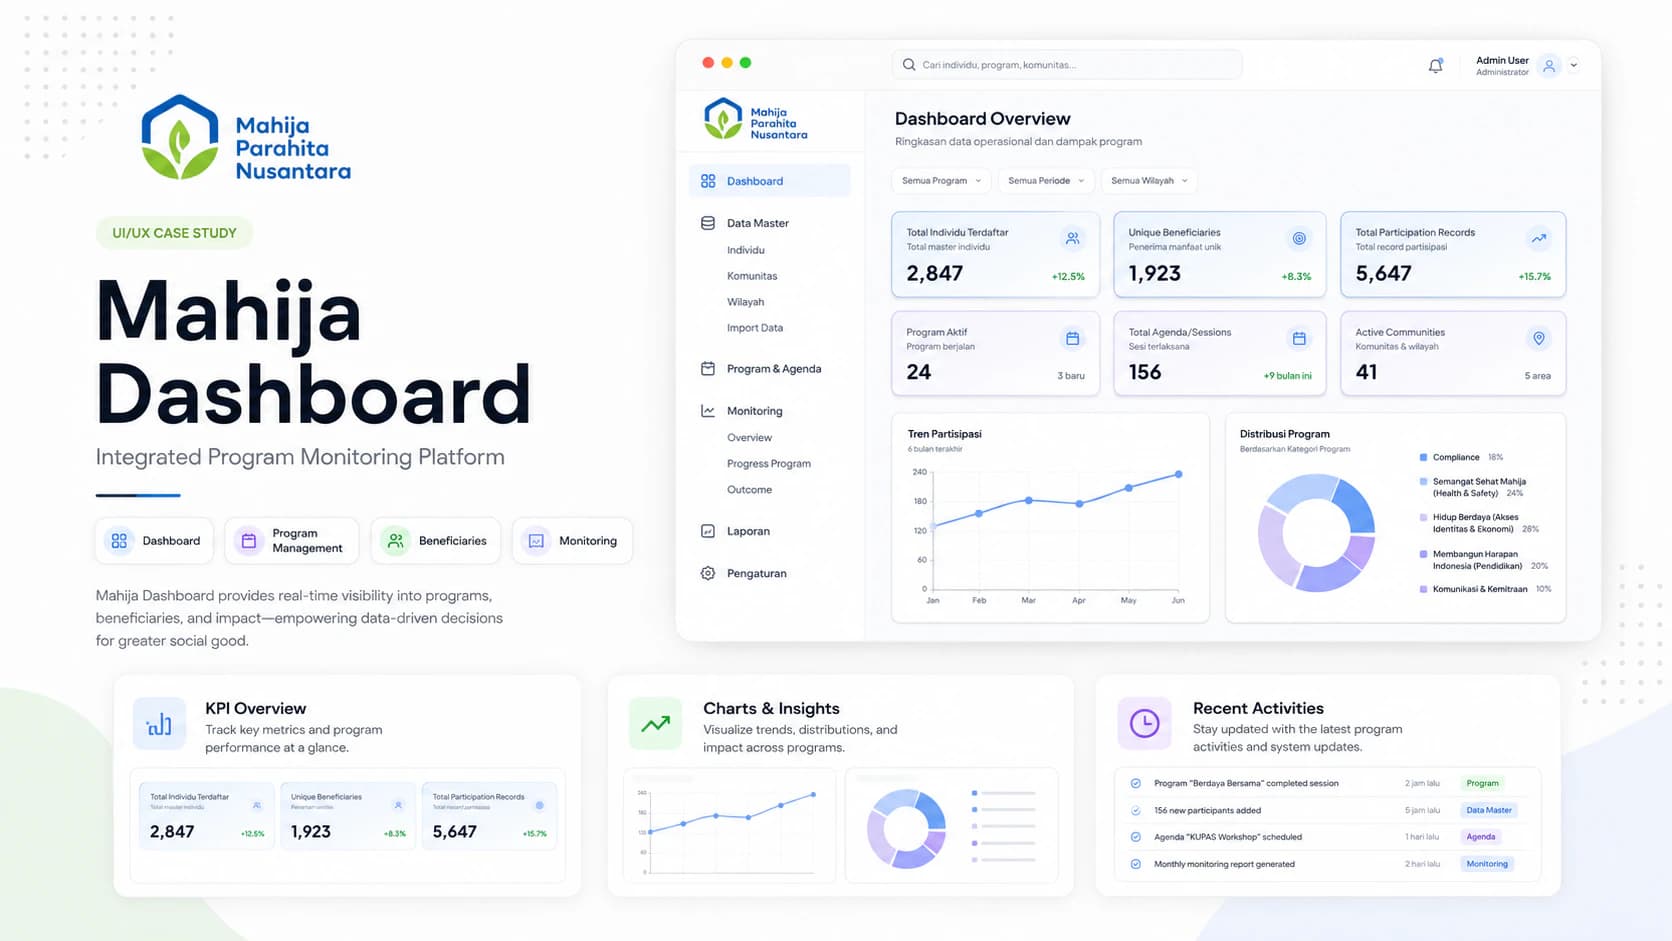
- Organization
- Yayasan Mahija Parahita Nusantara
- Role
- UI/UX Designer, Front-End Developer, Project Lead, and primary client liaison
- Timeline
- April 2026–August 2026
- Status
- Launched to production
- Contribution
- Led UI/UX, front-end delivery, project coordination, and client communication within a two-person core team, with one contributor joining during development.
- 0112 core modules
- 0280 responsive screens
- 03Production launch one month early
Project context
One organization, several disconnected ways of working
Mahija’s operational, administrative, and management teams handled programs, participants, beneficiaries, monitoring, evaluation, and reporting.
The existing setup combined an individual-only legacy website with spreadsheets, Google Forms, and other separate tools. Data and workflows were not integrated into one operational system.
My role and collaboration
Working across product design, delivery, and coordination
I worked as UI/UX Designer, Front-End Developer, Project Lead, and primary client liaison. This meant connecting workflow research and interface decisions with front-end implementation and project communication.
The team began with two core members. One contributor joined during development. We held weekly internal meetings and met with the client every two weeks.
Problem
Fragmented data made the operational picture difficult to manage
Programs, participant information, beneficiary records, monitoring, evaluation, and reporting lived across multiple tools. This fragmentation made program management, tracking, and extracting insights difficult.
The platform needed to support more than 10 programs and hundreds of beneficiary records without exposing private information in this case study.
Transformation
From separate records to one connected platform
Before
- Individual-only legacy website
- Spreadsheets
- Google Forms
- Other separate tools
After
One integrated beneficiary and program management platform
The case study uses only dummy or anonymized data and does not show internal beneficiary information.
Research and evidence
Understanding the workflows before defining the interface
- 01
Research
User and workflow research across the platform context.
- 02
Structure
Information architecture and user flows for the connected system.
- 03
Design
Responsive UI across 80 screens and a reusable Figma design system.
- 04
Validate
Usability validation supported by weekly internal meetings and client meetings every two weeks.
Key insights
The verified constraints that shaped the product
Different operational perspectives
The system had to support operational, administrative, and management workflows.
Connected program records
Programs, participants, beneficiaries, monitoring, evaluation, and reporting needed to work within one platform.
Scale across real program work
The scope covered more than 10 programs and hundreds of beneficiary records.
Responsive access
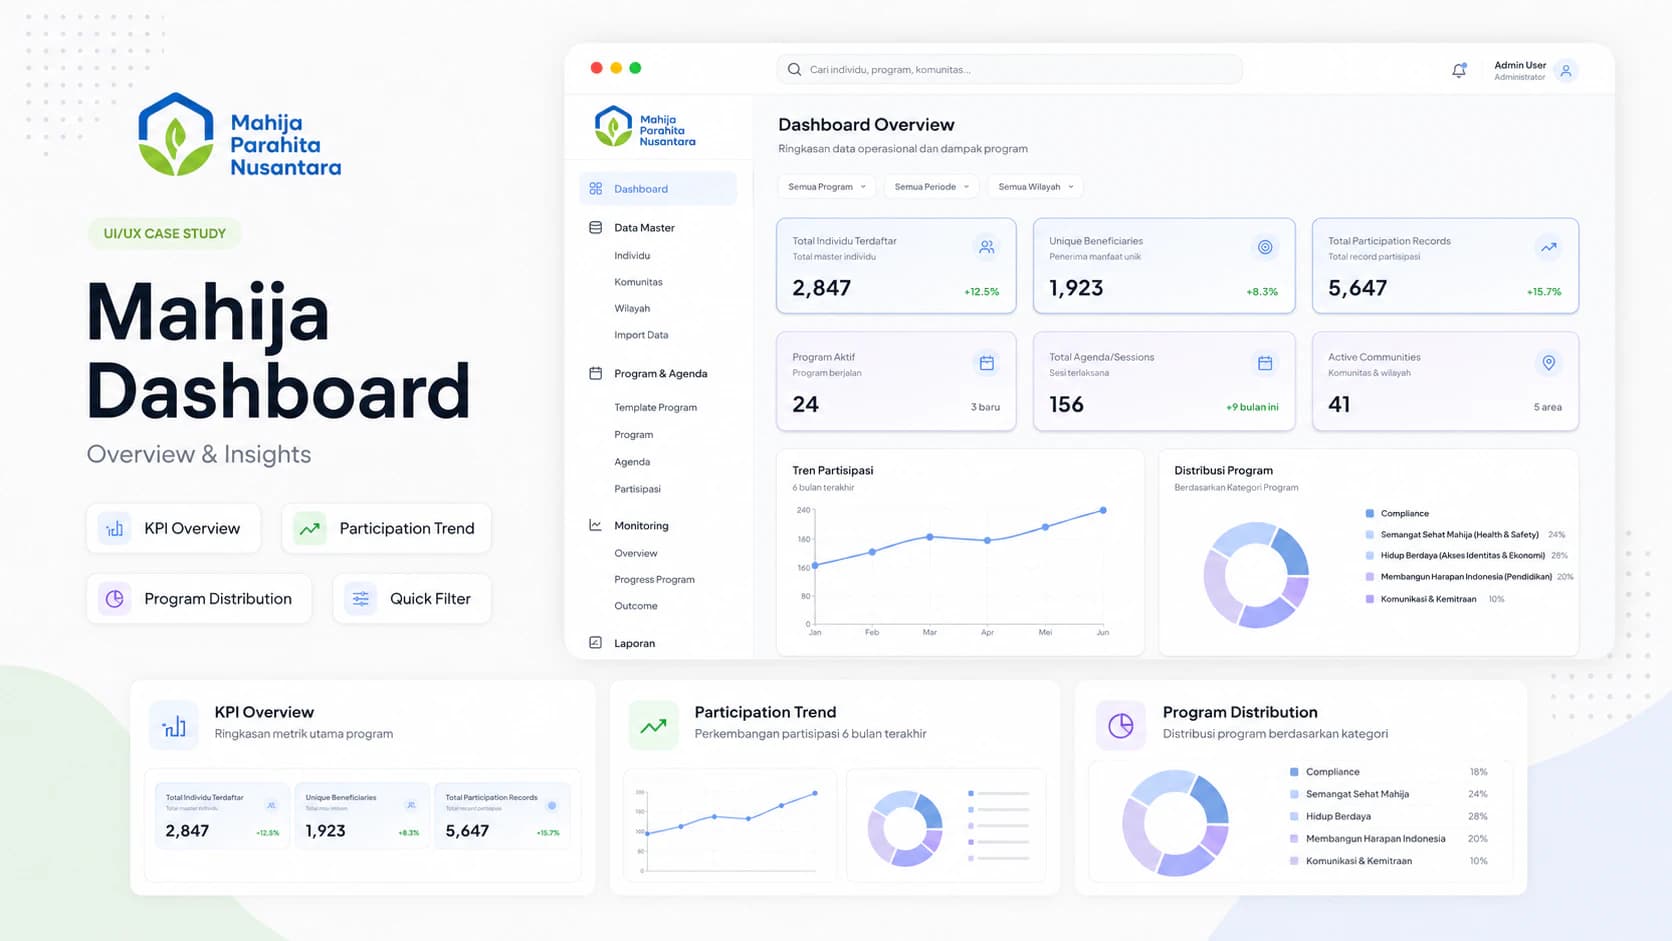
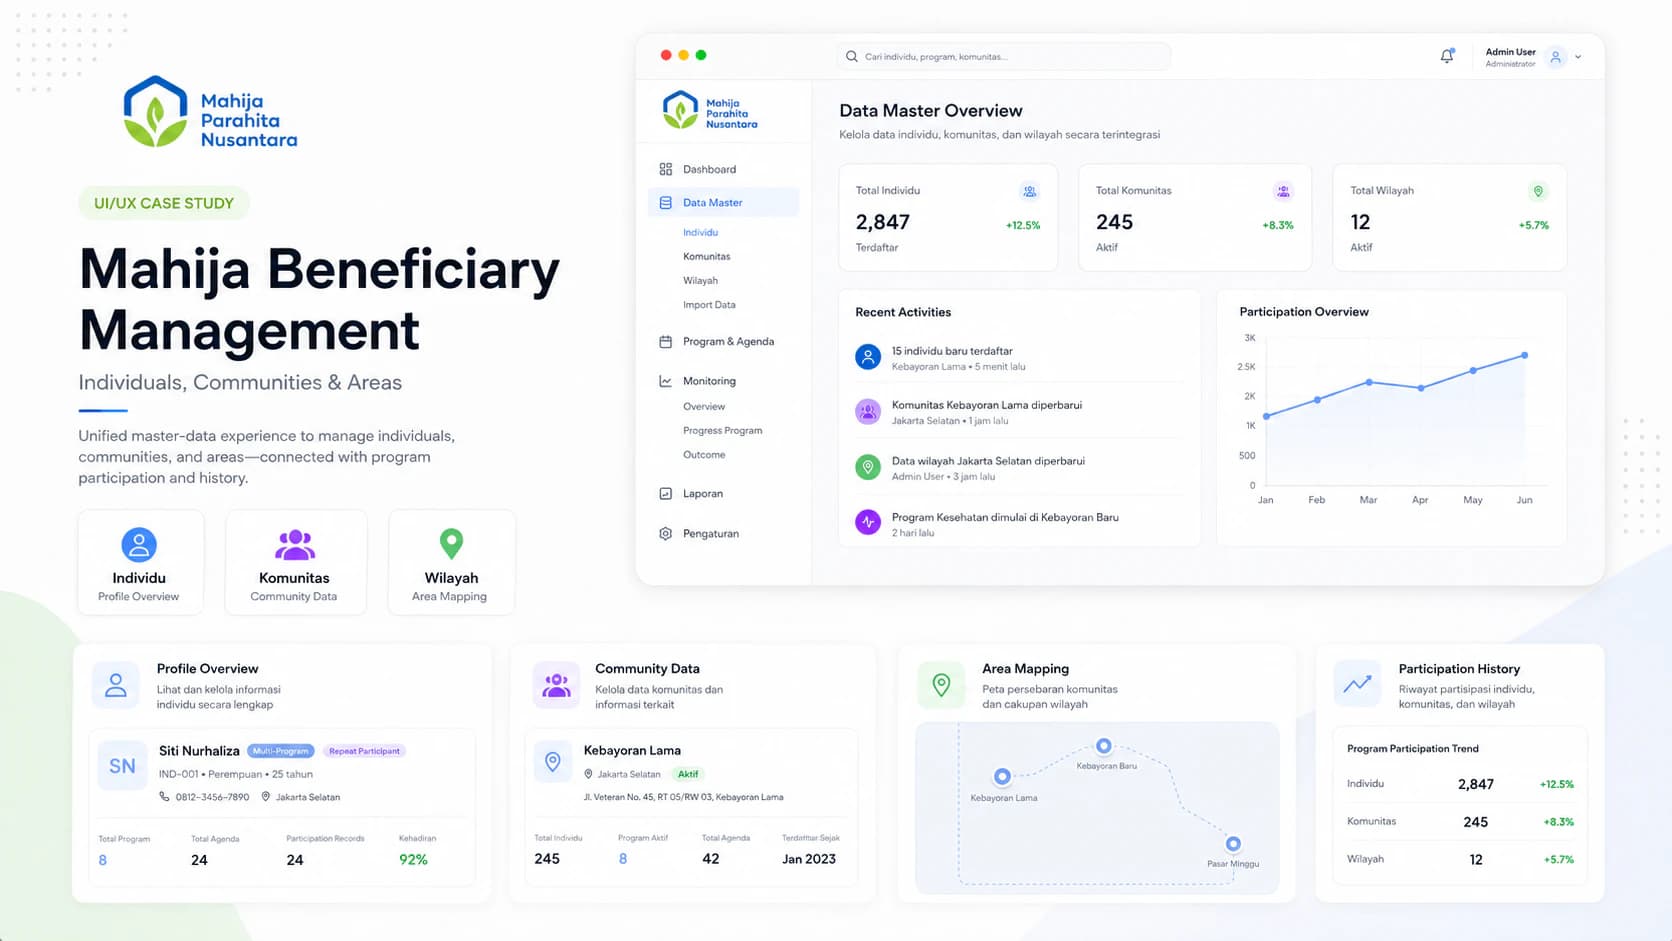
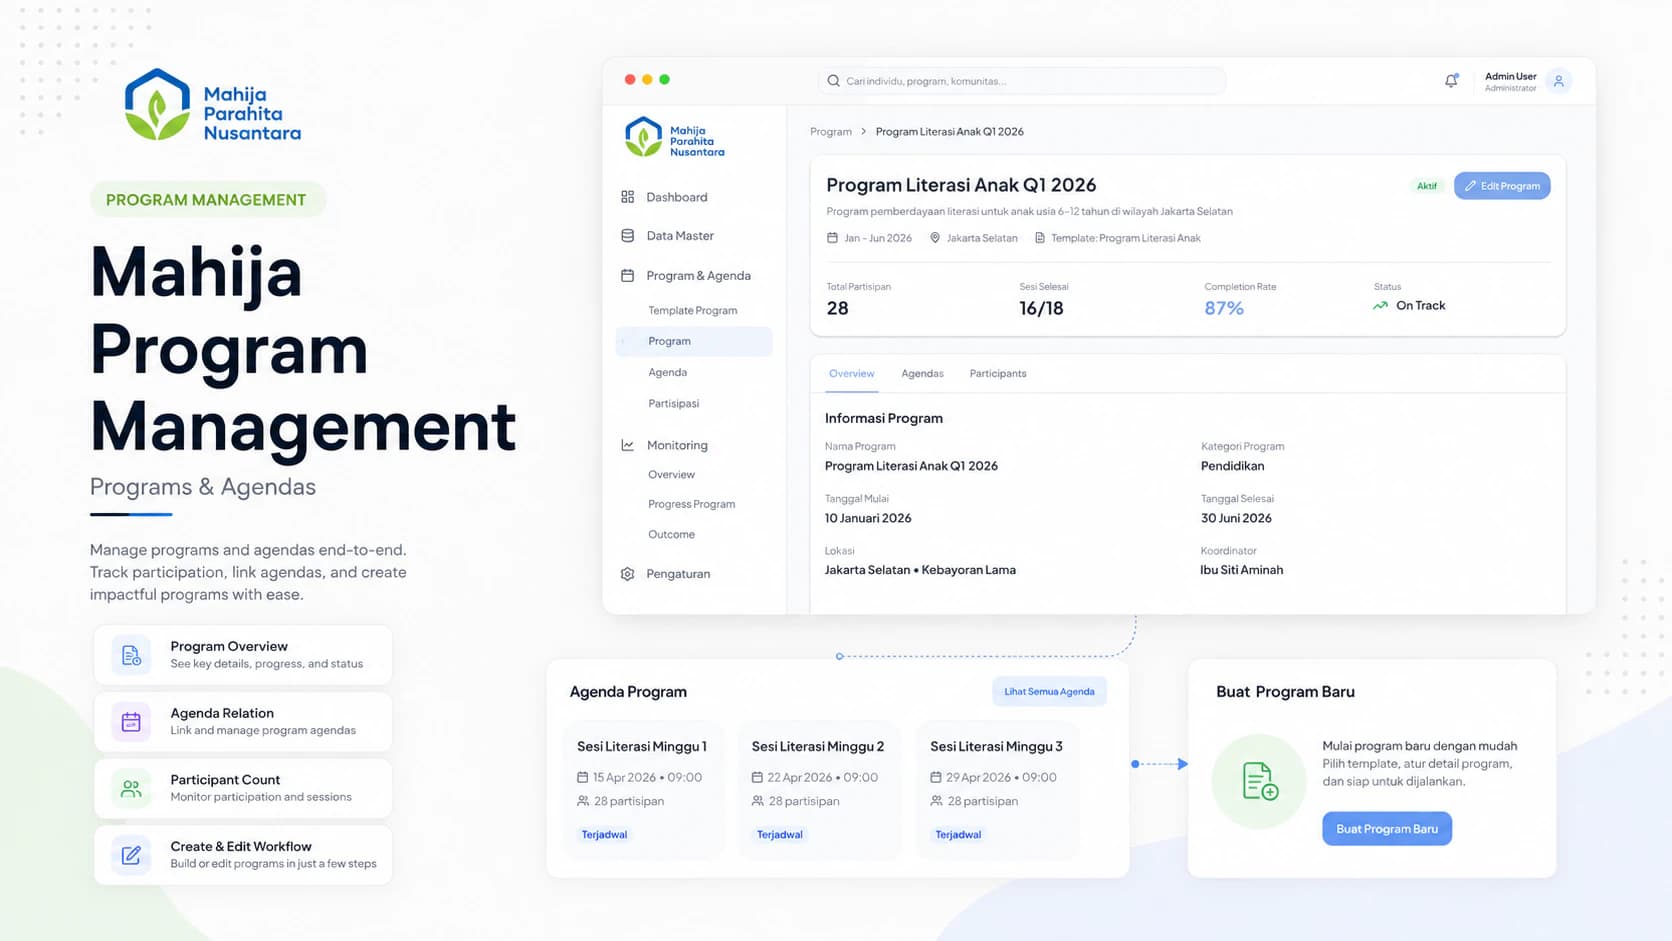
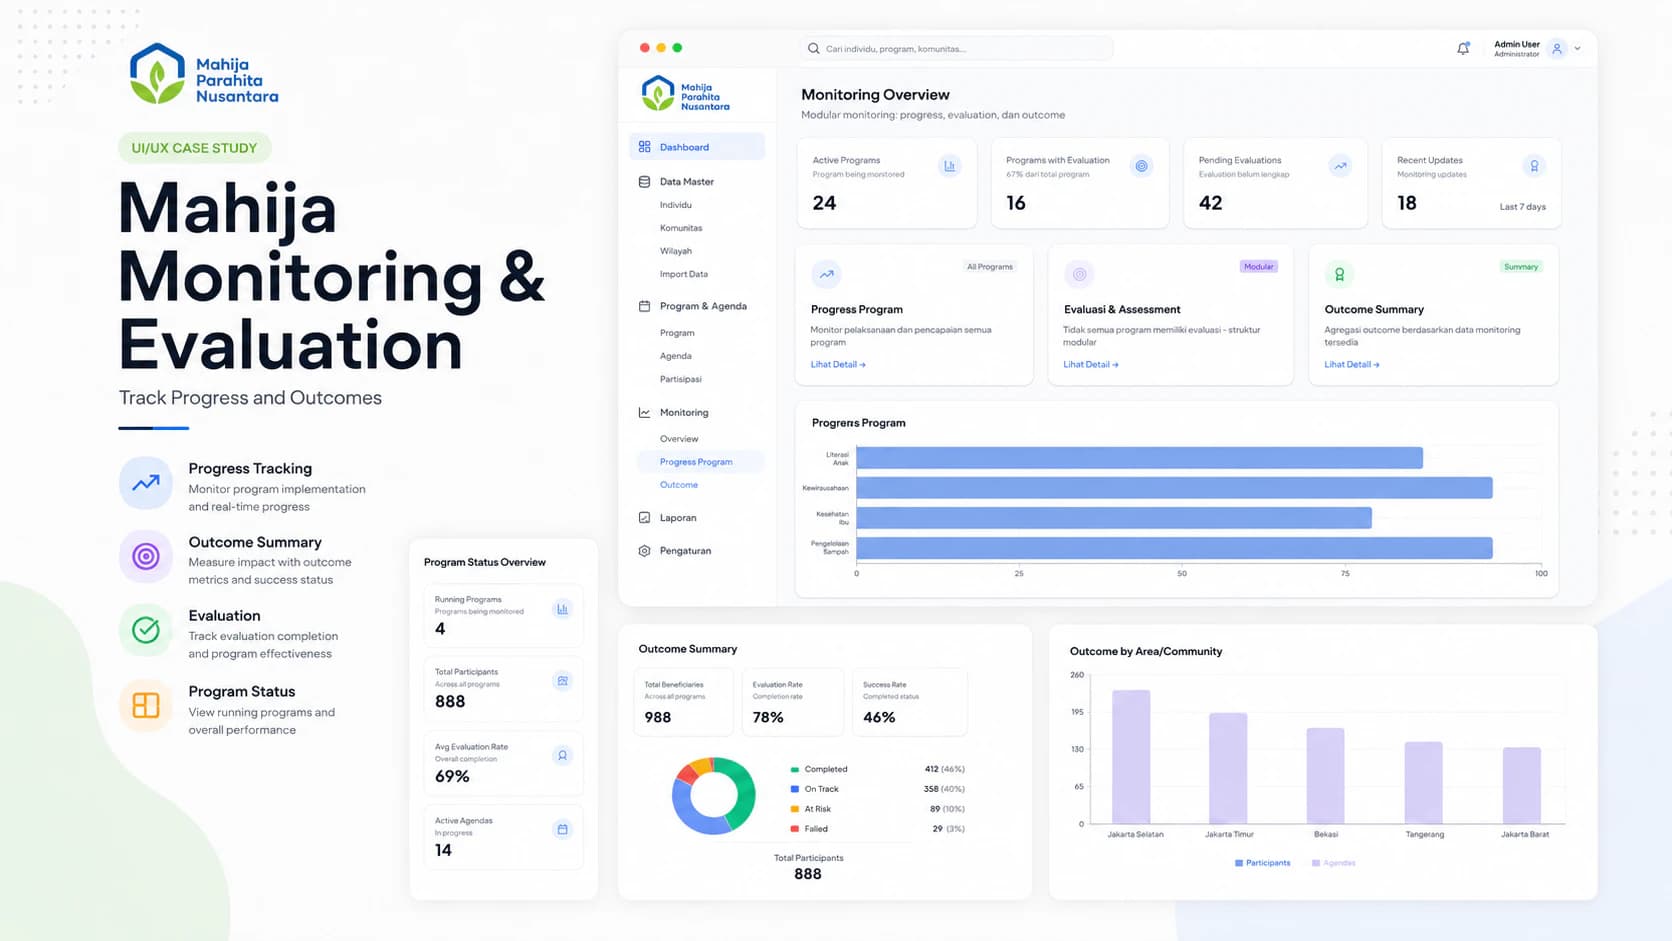
The delivered design covered 80 responsive screens across 12 core modules.
Information architecture and user flow
Structuring connected program work
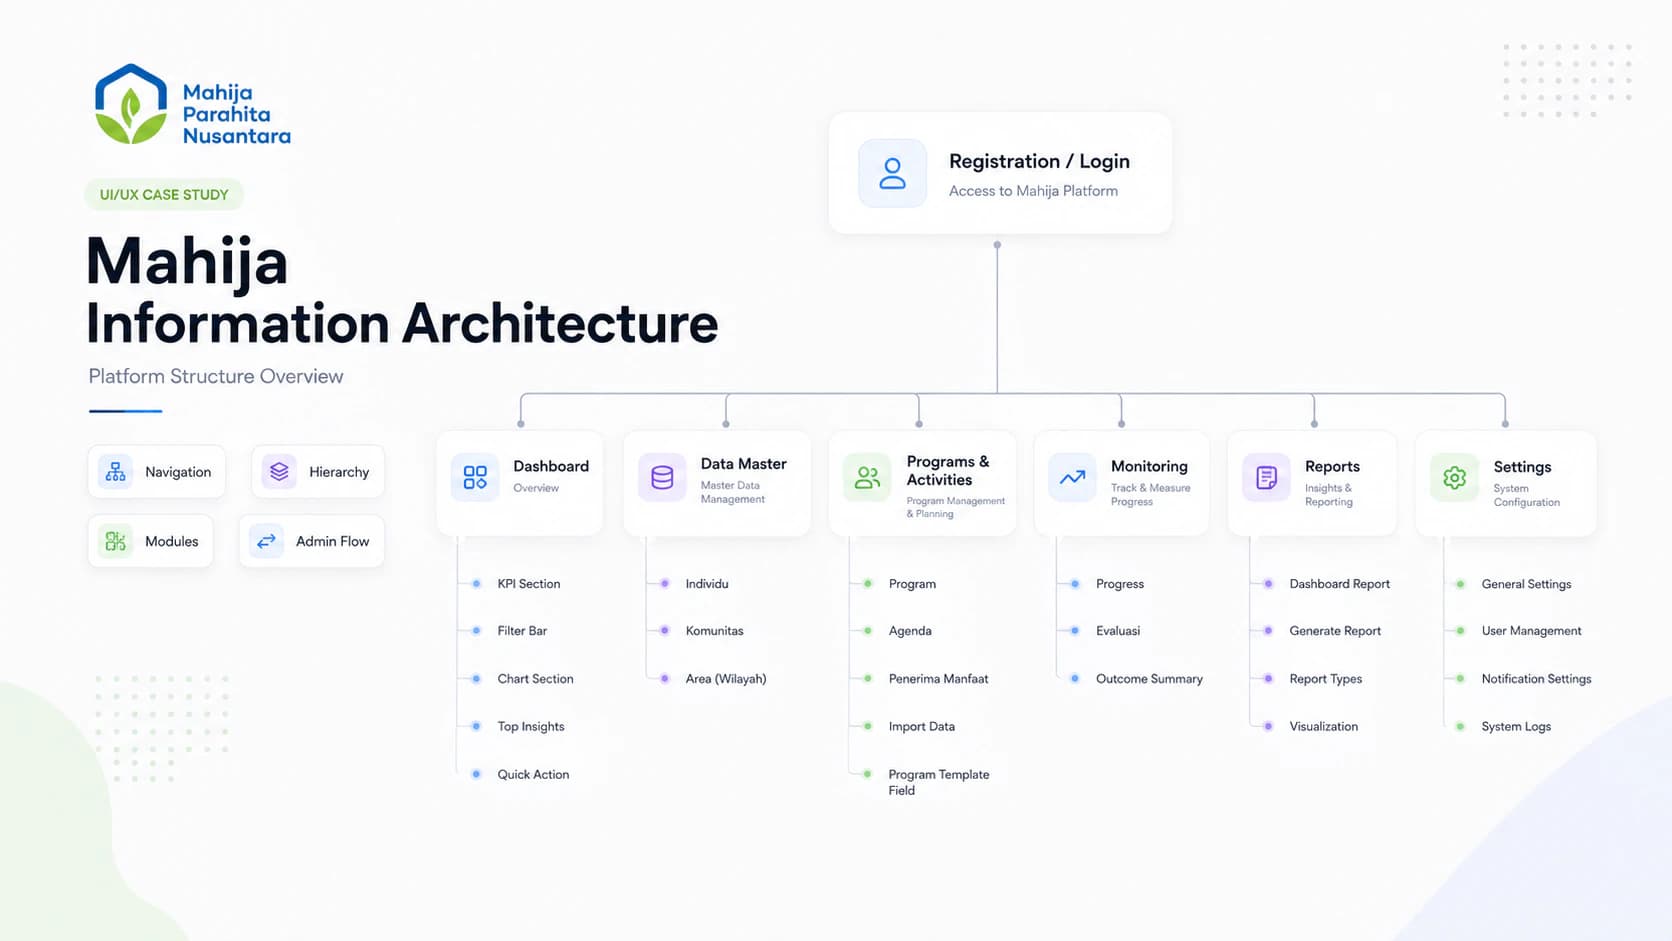
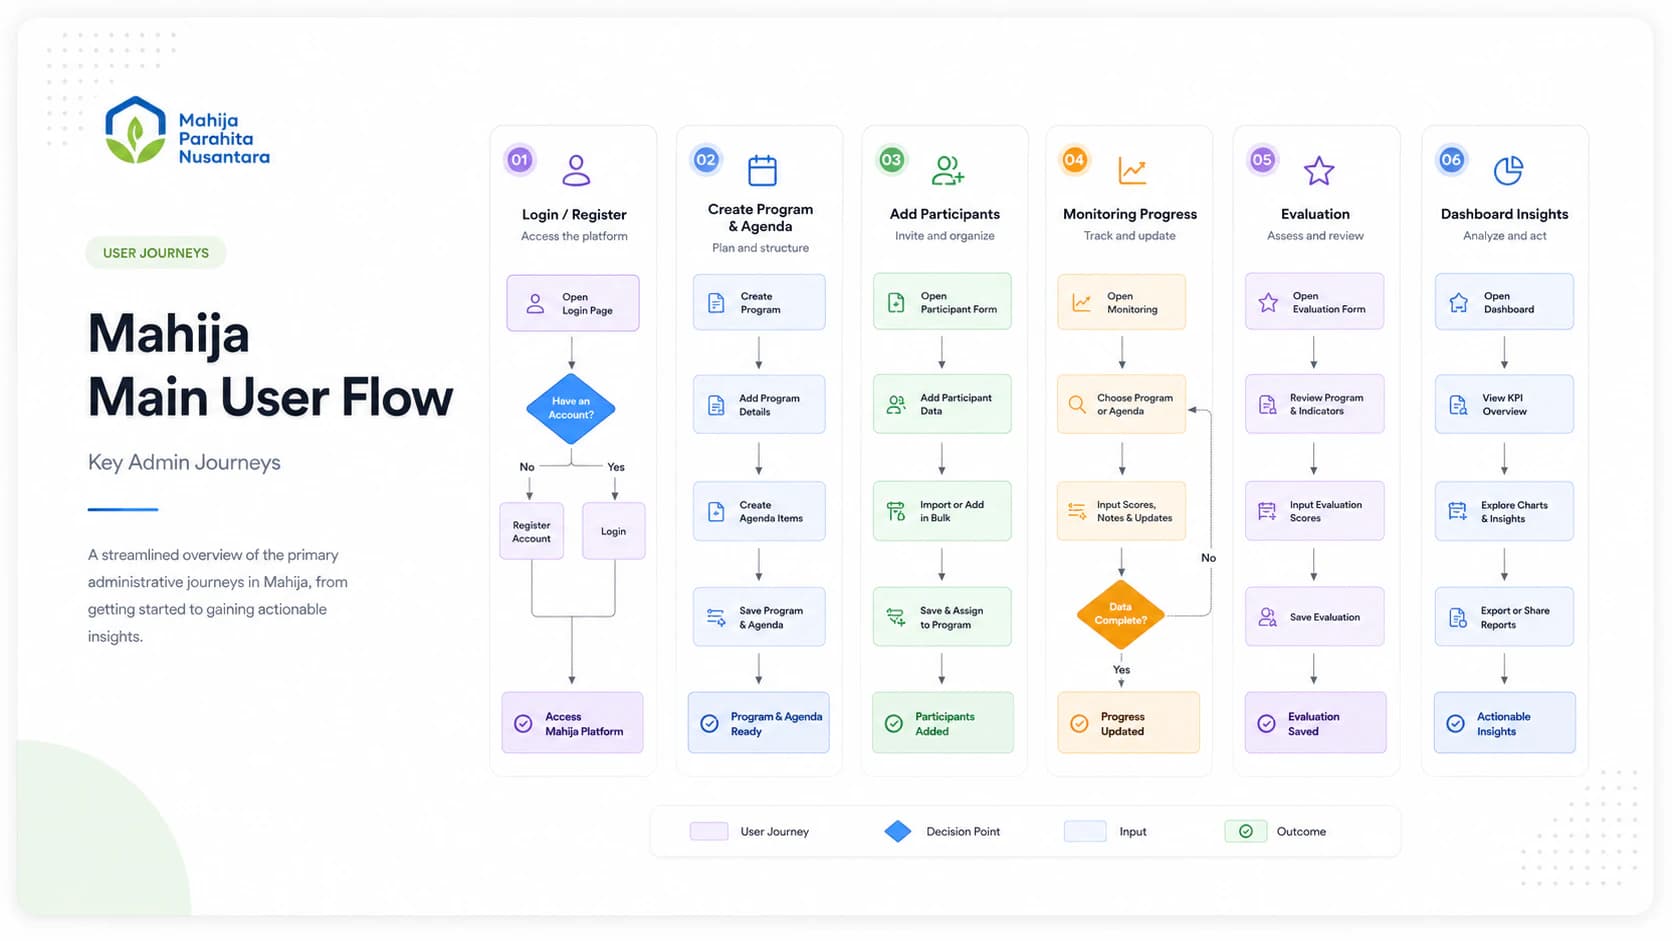
Module overview
A concise view of the platform scope
Programs
Program management for a scope of more than 10 programs.
People and records
Participant and beneficiary record workflows, represented here without private data.
Monitoring and evaluation
Connected monitoring and evaluation workflows within the platform.
Reporting
Reporting workflows supported by the integrated system.
Design exploration and decisions
Turning workflow structure into responsive interface decisions
The work moved from user and workflow research into information architecture, user flows, and responsive UI. The resulting scope comprised 80 responsive screens.
This case study does not infer unverified time savings, efficiency percentages, or adoption levels from those design decisions.
Design system
Reusable foundations for a broad product surface
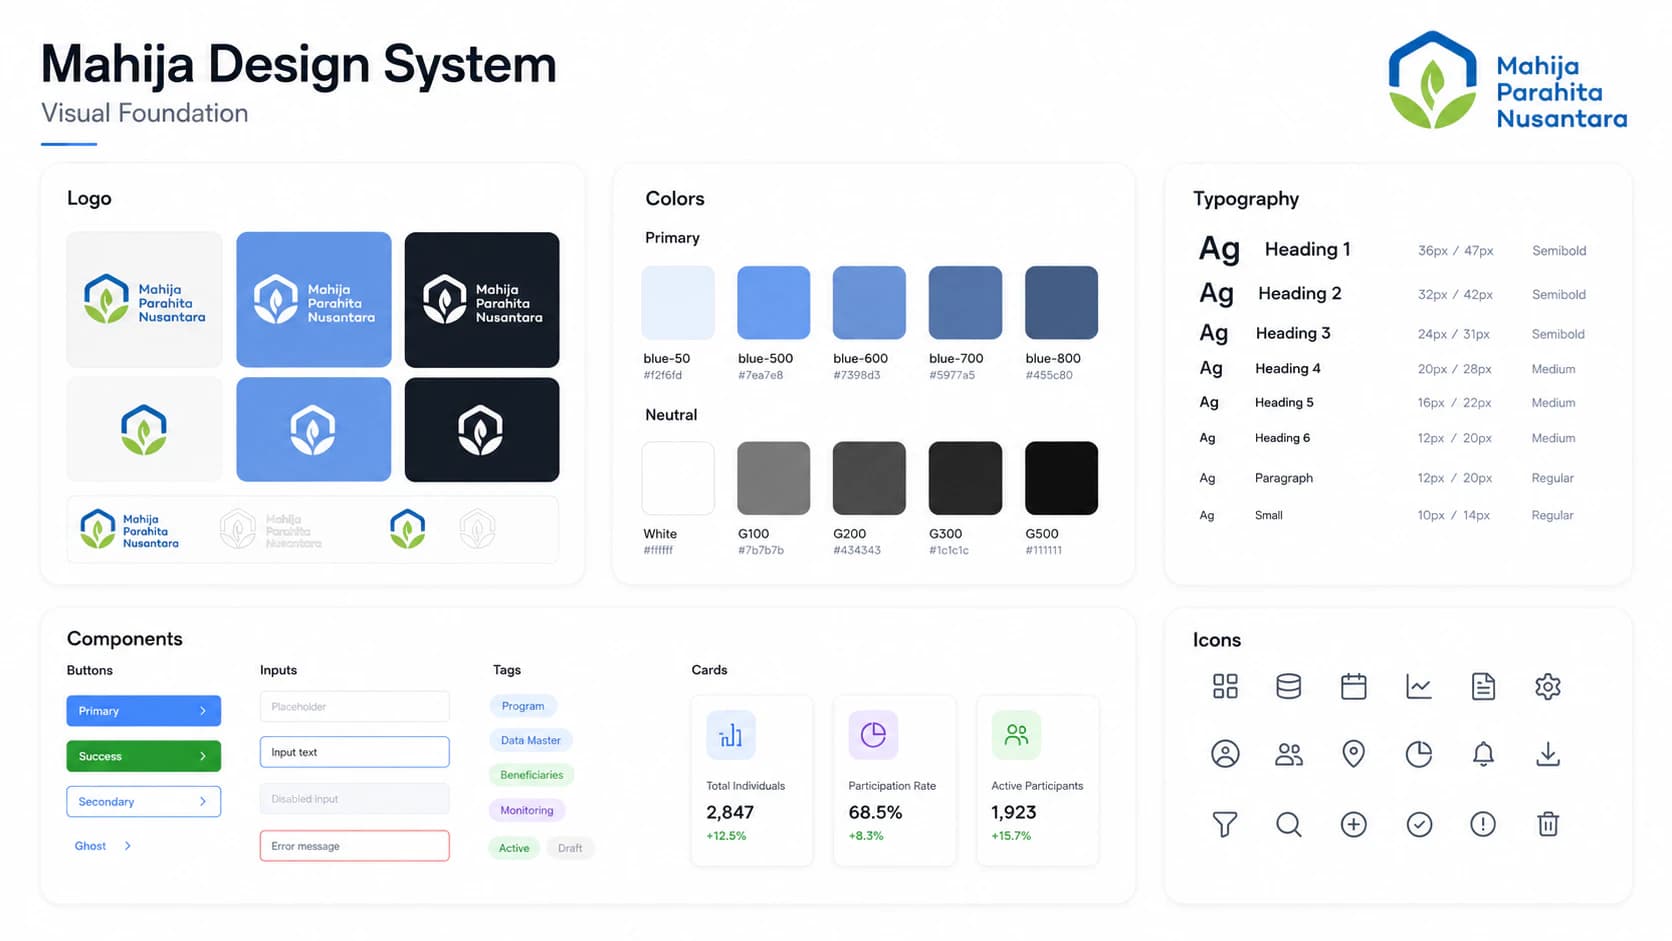
Usability testing
Validation was part of the delivery process
Usability validation was completed during the project. Detailed participant counts, findings, and test scores are not published because they are not verified in the content source of truth.
Final solution
One responsive platform for beneficiary and program management
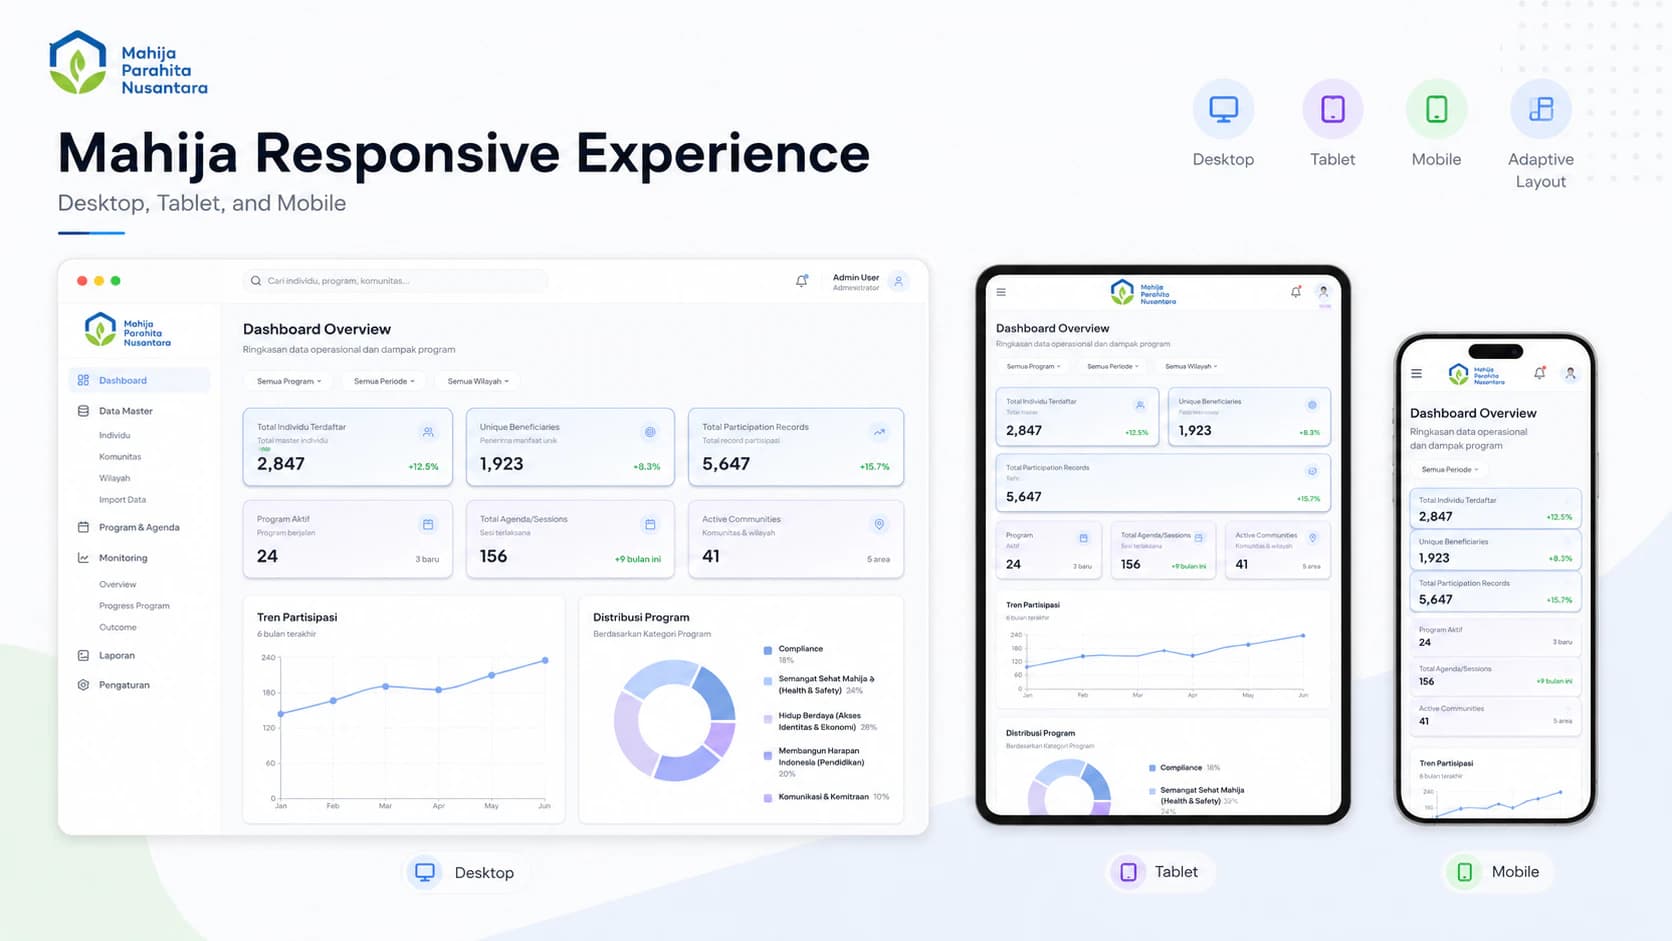
Content integrity
Private operational data stays private
Every future screenshot or recreated interface must use dummy names and values. Beneficiary identities, internal system information, private records, and unapproved analytics must not appear.
Implementation and project status
Designed and implemented for production
The platform was implemented with Next.js, React, and TypeScript. It launched to production in August 2026.
Impact
Production delivery one month ahead of schedule
The production launch was completed in August 2026, one month earlier than the original September deadline.
Broader staff-adoption figures are not available, so this case study does not claim adoption by all staff or quantify efficiency gains.
Reflection
What this project reinforced
What I learned
Balancing product design, front-end delivery, project leadership, and client communication required decisions to remain clear across both the product and its implementation. Translating operational complexity into a scalable information architecture was central to connecting the 12-module scope.
What I would do next
After broader staff adoption, the next step should be to measure verified usage across roles, task completion, recurring workflow friction, and whether the integrated data supports management and reporting needs. No results are assumed before that measurement exists.